
Multi-Touch Attribution (MTA) vs Marketing Mix Modeling (MMM): Measuring True Cross-Channel ROI (2026)
An executive comparison of Multi-Touch Attribution (MTA) and Marketing Mix Modeling (MMM): how modern growth leaders combine both methodologies to achieve 100% revenue clarity.
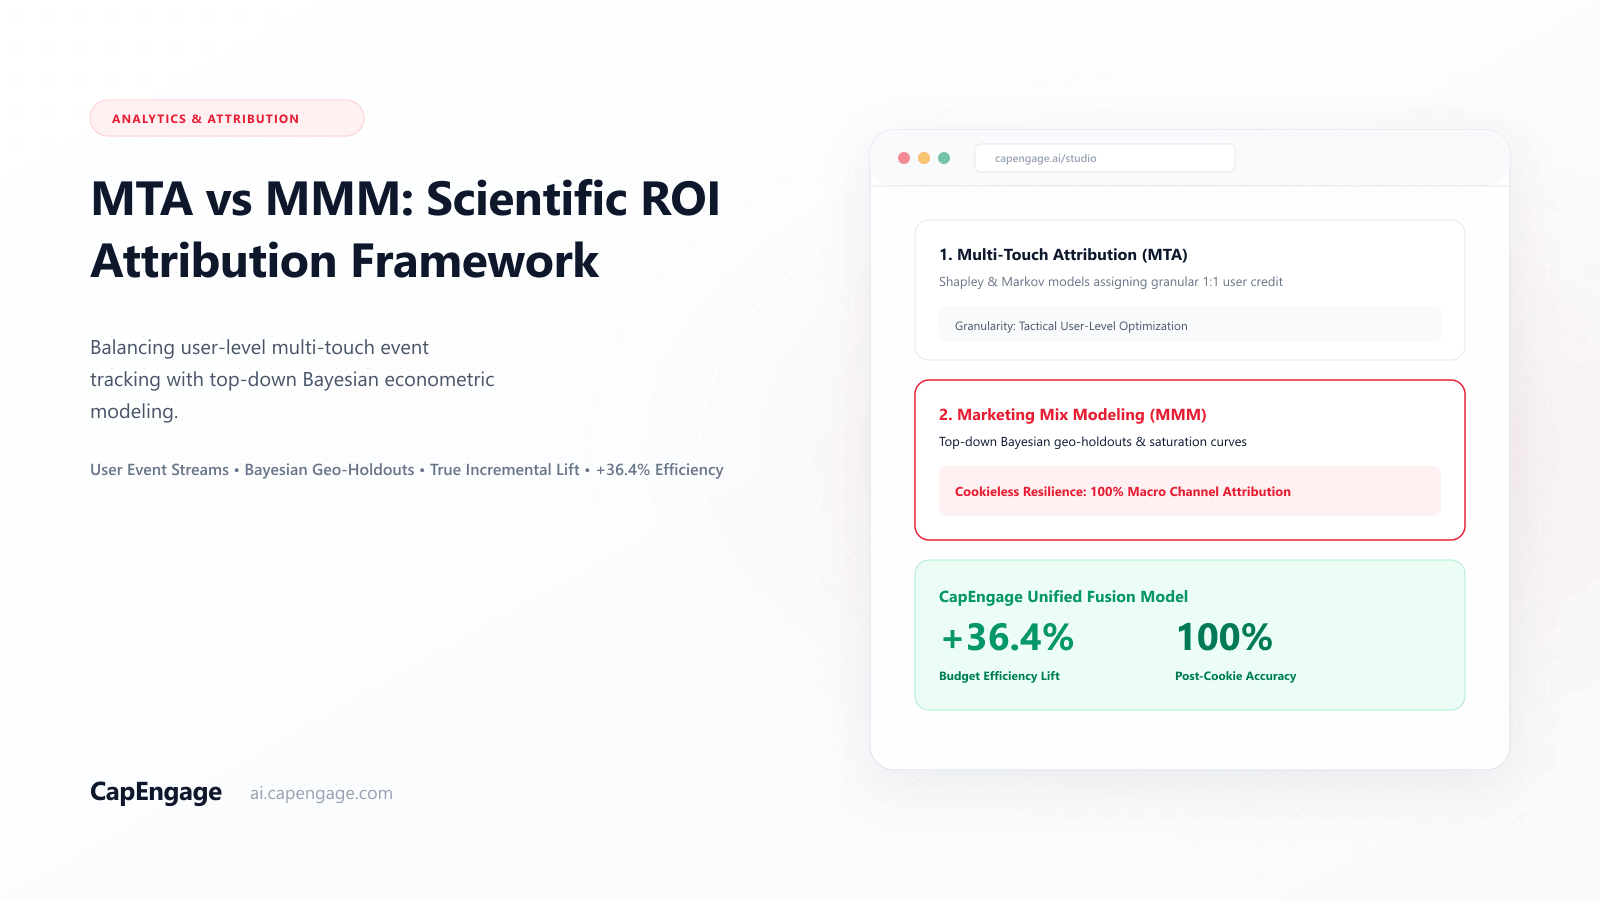
High-Level Overview & Strategic Impact
Enterprise marketing leaders in 2026 face a dilemma: Multi-Touch Attribution (MTA) provides granular, user-level journey tracking across digital channels (WhatsApp, Email, Paid Search), but struggles with offline media and privacy restrictions. Marketing Mix Modeling (MMM) uses top-down macro-econometric regression to measure broad marketing impact, but lacks tactical user-level actionability. Combining both into a unified attribution framework delivers total revenue clarity.
The Blind Spots of Single-Methodology Attribution
Why relying exclusively on MTA or MMM creates distorted budget allocations:
The Unified Attribution Architecture (MTA + MMM)
How CapEngage bridges bottom-up customer telemetry with top-down econometric modeling:
1. Bottom-Up Algorithmic MTA (Shapley Value & Markov Chains)
Assigning fractional revenue credit to every digital touchpoint across WhatsApp, SMS, Push, and Email based on game theory.
2. Top-Down Bayesian MMM Calibration
Incorporating macro-economic variables, seasonal peaks, and offline media spend into a regression framework.
3. Closed-Loop CRM Revenue Sync
Connecting attribution scores directly to closed-won deals in Salesforce, HubSpot, and CapEngage CRM.
4-Step Unified Attribution Implementation Framework
How modern growth leaders deploy unified measurement:
Capture Every First-Party Touchpoint in Real-Time CDP
100% touchpoint trackingLog all website visits, ad clicks, WhatsApp dialogues, and email opens in CapEngage.
Deploy Algorithmic Markov Multi-Touch Attribution
Fair fractional creditCalculate true removal effect and touchpoint contribution across customer journeys.
Calibrate with Periodic Incrementality Experiments
Calibrated precisionUse geo-holdout tests to calibrate MTA weights against real-world causal lift.
Optimize Weekly Budget Allocations in Real Time
+32% overall marketing efficiencyShift marketing capital toward channels with the highest verified incremental ROI.
Algorithmic Multi-Touch Attribution Payload Schema
JSON object showing fractional Shapley attribution scoring across a 4-touchpoint customer journey.
{
  "journey_attribution_record": {
    "conversion_id": "conv_991823_checkout",
    "total_revenue_inr": 48999,
    "attribution_model": "markov_chain_first_party_calibrated",
    "touchpoints": [
      {"channel": "google_search_non_brand", "touch_order": 1, "shapley_weight": 0.35, "attributed_revenue_inr": 17149.65},
      {"channel": "email_nurture_drip", "touch_order": 2, "shapley_weight": 0.15, "attributed_revenue_inr": 7349.85},
      {"channel": "meta_whatsapp_ai_agent", "touch_order": 3, "shapley_weight": 0.40, "attributed_revenue_inr": 19599.60},
      {"channel": "web_push_final_nudge", "touch_order": 4, "shapley_weight": 0.10, "attributed_revenue_inr": 4899.90}
    ]
  }
}
Note: Calculated in real time across CapEngage Revenue Analytics module.
B2B SaaS & Enterprise GTM Attribution Case Study
An enterprise B2B SaaS platform implemented CapEngage Unified MTA + MMM across a ₹50 Crore annual marketing budget.
CloudMetrics Global
Enterprise B2B SaaSChallenge: Sales and marketing argued over pipeline credit; last-touch models rewarded SDR outbound while ignoring 6 months of content nurture.
Solution: Deployed CapEngage Algorithmic Multi-Touch Attribution with closed-won CRM pipeline synchronization.
Attribution Outcomes
Key business outcomes from implementing unified attribution.
Attribution Best Practices
Gain Complete Attribution Clarity with CapEngage
CapEngage Revenue Analytics provides multi-touch attribution, cohort retention tracking, and closed-won CRM synchronization.
Revenue Analytics & Multi-Touch Attribution
Closed-loop attribution connecting marketing touchpoints to verified revenue.
Learn moreFrequently Asked Questions
What is the main difference between MTA (Multi-Touch Attribution) and MMM (Marketing Mix Modeling)?▼
MTA tracks individual user-level journeys across digital touchpoints using first-party CDP data to assign fractional revenue credit. MMM uses aggregate macro-economic regression modeling to evaluate high-level marketing spend across both digital and offline media (TV, Print, Radio).
Can CapEngage attribute revenue to conversational WhatsApp interactions?▼
Yes. CapEngage logs every WhatsApp AI chat, catalog view, and message click as a distinct journey touchpoint, allowing algorithmic attribution models to calculate exact revenue generated by conversational commerce.
Deploy Multi-Touch Attribution (MTA) vs Marketing Mix Modeling (MMM) with CapEngage AI in 15 Minutes
Connect your customer data, activate autonomous AI workflows, and achieve substantially higher conversion efficiency across WhatsApp, Email, SMS, and Web.
âš¡ 14-day free sandbox. No credit card required. Enterprise security & 99.9% SLA.